Mass Storage Performance Confluences and Coincidence: Things are not always what they seem
We still casually speak of disk performance.
However, the very phrase disk performance
conjures mental
images that
do not reflect present mass storage realities. Disk performance
summons forth pictures of physical disks with actual rotating media
and moving access arms. Like a recording artist saying
cut a tape,
it is an anachronistic reference to a far
earlier time, blending multiple generations of now-long past
technology.[1] The discrepancy between the conjured
mental model contradicts physical reality and muddles our
thought processes.
Present day mass storage technologies are often not so simply described. Incorrect mental images lead to sub-optimal decisions.
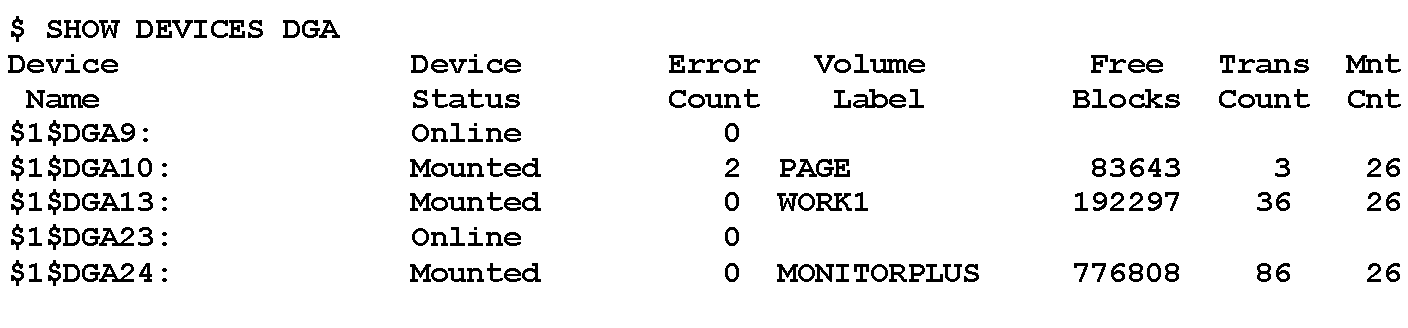
OpenVMS mass storage performance was once a matter of looking at FILES-11 volumes, available space, and activity. The DCL SHOW DEVICE command displayed gross available space, Figure 1. MONITOR[2] displayed second-to-second activity. T4[3] invokes MONITOR/RECORD from within submitted batch jobs to gather statistics over extended time periods for later analysis and graphing.
Virtualized device statistics present a virtual world disconnected from physical reality. In contrast, performance is pure physical reality.
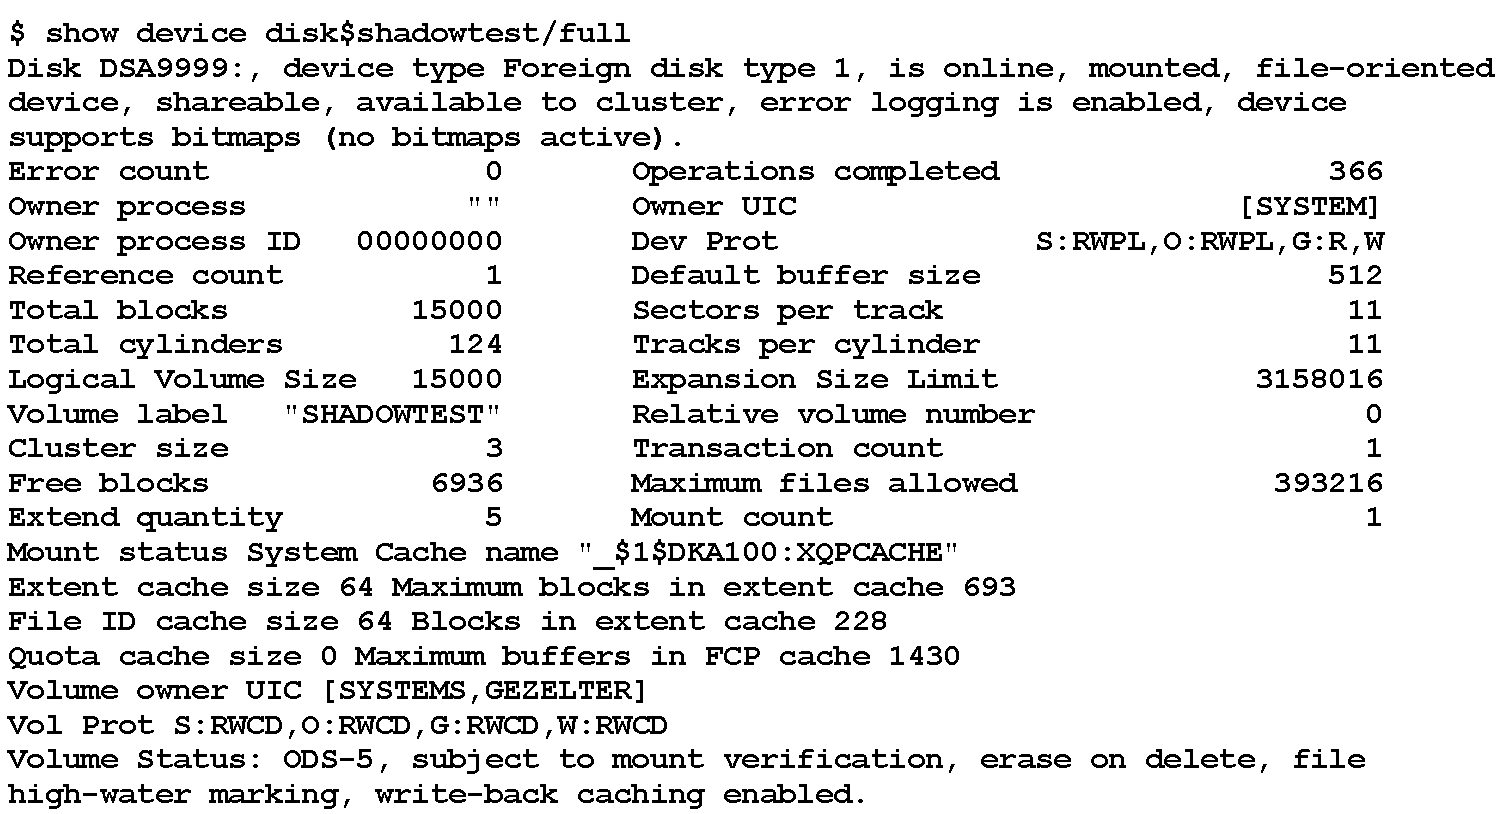
Nested virtualizations distort the relevance and accuracy of the OpenVMS device data displays. The DCL SHOW DEVICE/FULL command[4] displays physical geometry information about cylinders, tracks, and sectors/track, Figure 2, but such virtualized device data does not necessarily correspond to physical reality.
In what sometimes feels like a flashback to the original Star
Trek episode Spock's Brain,
[5] virtualization
often obscures and distorts the physical mass storage realities
visible to users and OpenVMS system managers. Identical
configuration reports from OpenVMS may be realized by
dramatically different physical implementations with different
performance characteristics. While one can
misreport all manner of information in the name of compatibility,
real-world performance is invariably real.
This is neither a sudden nor recent development. Emulations have misrepresented physical reality since at least the 1970s.[6] Misrepresentations simplify software and hardware compatibility, but in almost every case timing fidelity is sacrificed.
When computing transitioned from simple attached disks to logical volumes on controller-determined partitions, e.g., HPE P2000,[7] and pools of underlying storage, e.g., MSA2052,[8] the relevant activity data gathered by SHOW DEVICE and MONITOR became disconnected from physical reality and thus performance.
FILES-11 volume structures are well-insulated from the mundane details of storage device physical geometry and organization. The FILES-11 specification is exemplary in that all FILES-11 data structures are based upon Logical Block Numbers (LBNs) and offsets within LBNs.[9]
Performance is indisputably bound to the physical. Elapsed wall
time cannot be virtualized. Correctness does not imply high
performance.
The simple fact that one can migrate a physical
volume to a logical volume provisioned by a storage array may ease
the changes in the underlying hardware and software, but in no way
does functions
imply high performance.
Solid state disks (SSDs) have neither rotational nor arm movement delays. The absence of rotational and arm movement delays leads many to incorrectly conclude that SSDs have no delays. This belief is incorrect. That SSDs are generally faster than rotating media does not imply that they have no delays. SSDs have performance limitations, just not quite the same set of limitations as rotating media drives.
If the data stored on blocks belonging to two logical volumes reside on the same physical device, neither interface capacity nor physical SSD performance increases. The possible performance is merely divided between the two logical volumes. The same is true of two different SSDs connected via the same controller or interface. Merely dividing references into two groups does not itself increase performance.
What does this mean for systems managers and other IT team members?
Consider the disk
configuration previously shown in
Figure 1 by SHOW DEVICES.
The performance realized from this apparent configuration may vary dramatically depending upon the actual underlying physical configuration:
- A system using real, directly attached disks attached to a a PCIe or Fibre Channel controller;
- Logical volumes hosted by an HPE P2000 controller (Fixed pre-allocated disk partitions); or
- Logical volume hosted by an HPE MSA2052 (Demand-allocated storage pool hosted on multiple performance tiers of SSDs and HDDs)
There is also the undetermined question of whether any of the possible physical provisioning arrangements include controller-based RAID0 (striping), RAID1 (mirroring), or RAID5 (multi-drive error correction).
If one's point of view is limited to the applications level, it is entirely possible to be halfway through an analysis when stopping work for the day, only to come back the next day and find dramatically different performance numbers due to a behind-the-curtain configuration change at the storage controller. For that matter, $1$DGAxxx may have been migrated from one type of controller to a different type of controller.
For that matter, if your storage environment is shared, a system outside of your knowledge and visibility may or may not be placing a load on the Storage Area Network (SAN) or storage system, rendering your performance tuning efforts futile by randomly adding or removing load from the intermediate network and mass storage system. While networks and storage devices are often over-provisioned, over-provisioning is not a panacea. Routine high-intensity tasks, e.g., backups, shadow set copies, can and do place significant demands on resources, degrading the performance of seemingly unrelated operations.
Each layer of virtualization hides details from the user. However hidden, the physical implementation details remain relevant. Performance is always limited by physical reality.
It often seems daunting. Each additional nested or stacked virtualization layer distorts and obscures physical reality. The complexity and distortion can be mastered by examining each of the layers in turn to develop understanding of how each layer impacts performance.
Future installments on storage virtualization will examine different storage virtualization aspects and their performance impact.
Notes
| [1] |
His mind wandered, seeking other examples. People-particularly older ones-still spoke of putting film into a camera, or gas into a car. Even the phrase Arthur C. Clarke, 2010: Odyssey Two
|
| [2] | VSI (2024) VSI OpenVMS DCL Dictionary: A-M, pp 306, et seq. |
| [3] |
VSI (2025) Total Time Tracking Tool (T4) |
| [4] | VSI (2024) VSI OpenVMS DCL Dictionary: A-M, pp 323, et seq. |
| [5] |
Spock's Brain, Star Trek Season 3, Episode 1 |
| [6] | The IBM 2316 disk drive on IBM 1130 computer systems "emulated" multiple IBM 2315 drives using a single drive. In reality, there was a single access arm assembly pretending to be five independent access arms. |
| [7] | HPE (2017, October 23) HPE MSA P2000 G3 Modular Smart Array Systems |
| [8] | HPE (2024, November 13) HPE MSA 2052 SAN Storage - QuickSpecs |
| [9] | Kirby McCoy (1990) VMS File System Internals Digital Press. ISBN 1-55558-056-4 |
References
- Andrew C. Goldstein (1975, June 19) Files-11 On-Disk Structure Specification Retrieved from https://bitsavers.org/pdf/dec/pdp11/rsx11m_s/Files-11_ODS-1_Spec_Jun75.pdf on December 2, 2025
- Andrew C. Goldstein (1985, January 11) Files-11 On-Disk Structure Specification Retrieved from https://web-docs.gsi.de/~kraemer/COLLECTION/VMS/ods2.txt on December 2, 2025
- HPE (2017, October 23) HPE MSA P2000 G3 Modular Smart Array Systems - QuickSpecs, Version 48 Retrieved from https://support.hpe.com/hpesc/public/docDisplay?docId=c04168365&docLocale=en_US on December 2, 2025
- HPE (2024, November 13) HPE MSA 2052 SAN Storage - QuickSpecs, Version 23 Retrieved from https://www.hpe.com/psnow/doc/a00008277enw on December 2, 2025
- HPE (2010, September 20) HP P2000G3 MSA System CLI Reference Manual Retrieved from https://support.hpe.com/hpesc/public/docDisplay?docId=c02520779&docLocale=en_US on December 2, 2025
- IMDB (?)
Spock's Brain
, Star Trek Season 3, Episode 1 Retrieved from https://www.imdb.com/title/tt0708449/ on December 2, 2025 - Steven Lieman (2004)
TimeLine-Driven Collaboration with T4 & Friends: A Time saving Approach to OpenVMS Performance
in OpenVMS Technical Journal, Volume 3 Retrieved from https://www.bitsavers.org/pdf/dec/vax/vms/openvms_technical_journal/OpenVMS_Technical_Journal_v03_200401.pdf on December 2, 2025 - VSI (2025)
Total Time Tracking Tool (T4)
Retrieved from https://products.vmssoftware.com/t4 on December 2, 2025 - VSI (2024) VSI OpenVMS DCL Dictionary: N-Z Retrieved from https://docs.vmssoftware.com/docs/vsi-openvms-dcl-dictionary-n-z.pdf on December 2, 2025
- VSI (2024) VSI OpenVMS DCL Dictionary: A-M Retrieved from https://docs.vmssoftware.com/docs/vsi-openvms-dcl-dictionary-a-m.pdf on December 2, 2025
- VSI (2025) VSI OpenVMS System Manager's Manual, Volume 2: Tuning, Monitoring, and Complex Systems Document Number: DO-DSYMV2-01A Retrieved from https://docs.vmssoftware.com/docs/vsi-openvms-system-manager-s-manual-volume-2-tuning-monitoring-and-complex-systems.pdf on December 2, 2025
- VMS Software, Inc. (2019, August)
Appendix A: Files-11 Disk Structure
VSI OpenVMS System Manager's Manual, Volume 2: Tuning, Monitoring, and Complex Systems Retrieved from http://.html on December 2, 2025
URLs for referencing this entry


|

|

|
|


![[Valid Atom 1.0]](http://images.rlgsc.com/logos/valid-atom.png "Validate my Atom 1.0 feed")
![[Valid RSS]](http://images.rlgsc.com/logos/valid-rss.png "Validate my RSS feed")